> ## Documentation Index
> Fetch the complete documentation index at: https://bifrost-backport-mcp-oauth2-server.mintlify.site/llms.txt
> Use this file to discover all available pages before exploring further.
# Telemetry
> Comprehensive Prometheus-based monitoring for Bifrost Gateway with custom metrics and labels.
## Overview
Bifrost provides built-in telemetry and monitoring capabilities through Prometheus metrics collection. The telemetry system tracks both HTTP-level performance metrics and upstream provider interactions, giving you complete visibility into your AI gateway's performance and usage patterns.
**Key Features:**
* **Prometheus Integration** - Native metrics collection at `/metrics` endpoint
* **Comprehensive Tracking** - Success/error rates, token usage, costs, and cache performance
* **Custom Labels** - Configurable dimensions for detailed analysis
* **Dynamic Headers** - Runtime label injection via `x-bf-dim-*` headers
* **Cost Monitoring** - Real-time tracking of AI provider costs in USD
* **Cache Analytics** - Direct and semantic cache hit tracking
* **Async Collection** - Zero-latency impact on request processing
* **Multi-Level Tracking** - HTTP transport + upstream provider metrics
The telemetry plugin operates asynchronously to ensure metrics collection doesn't impact request latency or connection performance.
***
## Default Metrics
### HTTP Transport Metrics
These metrics track all incoming HTTP requests to Bifrost:
| Metric | Type | Description |
| - | - | - |
| `http_requests_total` | Counter | Total number of HTTP requests |
| `http_request_duration_seconds` | Histogram | Duration of HTTP requests |
| `http_request_size_bytes` | Histogram | Size of incoming HTTP requests |
| `http_response_size_bytes` | Histogram | Size of outgoing HTTP responses |
Labels:
* `path`: HTTP endpoint path
* `method`: HTTP verb (e.g., `GET`, `POST`, `PUT`, `DELETE`)
* `status`: HTTP status code
* custom labels: Custom labels configured in the Bifrost configuration
### Upstream Provider Metrics
These metrics track requests forwarded to AI providers:
| Metric | Type | Description | Labels |
| - | - | - | - |
| `bifrost_upstream_requests_total` | Counter | Total requests forwarded to upstream providers | Base Labels, custom labels |
| `bifrost_success_requests_total` | Counter | Total successful requests to upstream providers | Base Labels, custom labels |
| `bifrost_error_requests_total` | Counter | Total failed requests, by raw status and normalized reason | Base Labels, `status_code`, `error_type`, custom labels |
| `bifrost_upstream_latency_seconds` | Histogram | Latency of upstream provider requests | Base Labels, `is_success`, custom labels |
| `bifrost_overhead_latency_microseconds` | Histogram | Total Bifrost overhead per request in microseconds (Bifrost's own work, excluding upstream provider time) | Base Labels, custom labels |
| `bifrost_overhead_component_microseconds` | Histogram | Same overhead broken down by internal component. Opt-in via `overhead_breakdown_enabled`; populated only when tracing is active | Base Labels, `overhead_component`, custom labels |
| `bifrost_input_tokens_total` | Counter | Total input tokens sent to upstream providers | Base Labels, custom labels |
| `bifrost_output_tokens_total` | Counter | Total output tokens received from upstream providers | Base Labels, custom labels |
| `bifrost_cache_hits_total` | Counter | Total cache hits by type (direct/semantic) | Base Labels, `cache_type`, custom labels |
| `bifrost_cost_total` | Counter | Total cost in USD for upstream provider requests | Base Labels, custom labels |
| `bifrost_active_requests` | Gauge | LLM requests currently in-flight | `method` |
| `bifrost_provider_key_up` | Gauge | Per-key health: `1` after a successful attempt, `0` after a failure | `provider`, `key_id`, `key_name` |
| `bifrost_key_rotation_events_total` | Counter | Key rotations triggered by per-key failures — rate-limit (429), auth (401/403), or billing (402) — one increment per actual swap | `provider`, `requested_model`, `key_id`, `key_name`, `fail_reason` |
| `bifrost_request_retries` | Histogram | Number of retries used per request (observed once per request; buckets `0,1,2,3,5,10`). | Base Labels |
| `bifrost_routing_embedding_requests_total` | Counter | Embedding calls made by semantic complexity routing | `provider`, `model`, `phase` (`request` or `warmup`) |
| `bifrost_routing_embedding_cost_total` | Counter | Cost in USD of semantic complexity routing embeddings | `provider`, `model`, `phase` (`request` or `warmup`) |
Base Labels:
* `provider`: AI provider name (e.g., `openai`, `anthropic`, `azure`)
* `model`: Model name (e.g., `gpt-4o-mini`, `claude-3-sonnet`)
* `alias`: Alias resolved to this model (empty if none)
* `method`: Request type (`chat`, `text`, `embedding`, `speech`, `transcription`)
* `virtual_key_id`: Virtual key ID
* `virtual_key_name`: Virtual key name
* `routing_engine_used`: Comma-separated routing engines used (`routing-rule`, `governance`, `loadbalancing`, `model-catalog`, `core`). `core` is emitted when the Bifrost orchestrator itself makes a routing decision — i.e. a fallback transition or a retry transition.
* `routing_rule_id`: Routing rule ID that matched the request
* `routing_rule_name`: Routing rule name that matched the request
* `complexity_tier`: Complexity tier used for routing (`SIMPLE` / `MEDIUM` / `COMPLEX`); empty when no routing rule referenced `complexity_tier`
* `complexity_mechanism`: How the effective complexity tier was determined (`semantic`, `llm`, `session`, or `skipped` when no tier was produced). The raw complexity score is deliberately not a label because it has unbounded cardinality; it is recorded in request logs and traces
* `selected_key_id`: ID of the key that successfully served the request (empty string `""` on final errors)
* `selected_key_name`: Name of the key that successfully served the request (empty string `""` on final errors)
* `fallback_index`: Fallback index (0 for first attempt, 1 for second attempt, etc.)
* `team_id` / `team_name`: Team identifiers (empty when governance is not used)
* `customer_id` / `customer_name`: Customer identifiers (empty when governance is not used)
* custom labels: Custom labels configured in the Bifrost configuration
`user_id` / `user_name` are not Base Labels. They are opt-in via the telemetry plugin's `user_labels_enabled` config field, because user identity has unbounded cardinality and multiplies series count. See [Prometheus → User Labels](/features/observability/prometheus#user-labels).
`bifrost_overhead_component_microseconds` is off by default. Enable it with the telemetry plugin's `overhead_breakdown_enabled` config field (a sibling of `metrics_enabled`). It carries the Base Labels above plus an `overhead_component` label whose value is one of ten fixed categories (`serialization`, `conversion`, `plugins`, `middleware`, `routing`, `processing`, `networking`, `streaming`, `miscellaneous`, `other`), the same categories the Bifrost UI's log-detail overhead breakdown groups into; summing the components for a given label set reconstructs `bifrost_overhead_latency_microseconds`. Because the breakdown is derived from completed trace spans, it only populates when tracing is active for the request. See [Prometheus → Overhead Breakdown](/features/observability/prometheus#overhead-breakdown).
### Streaming Metrics
These metrics capture latency characteristics specific to streaming responses:
| Metric | Type | Description | Labels |
| - | - | - | - |
| `bifrost_stream_first_token_latency_seconds` | Histogram | Time from request start to first streamed token | Base Labels |
| `bifrost_stream_inter_token_latency_seconds` | Histogram | Latency between subsequent streamed tokens | Base Labels |
### MCP Metrics
These metrics track MCP (Model Context Protocol) tool calls executed through Bifrost:
| Metric | Type | Description | Labels |
| - | - | - | - |
| `bifrost_mcp_client_operation_duration_seconds` | Histogram | Duration of an MCP tool call, as observed by Bifrost (the MCP client). `_count` gives call volume; a non-empty `error_type` marks failures. | `mcp_client`, `mcp_tool_name`, `mcp_method`, `error_type`, MCP governance labels, custom labels |
MCP Labels:
* `mcp_client`: MCP server label (client name) the tool belongs to
* `mcp_tool_name`: Tool name invoked
* `mcp_method`: MCP method — `tools/call`
* `error_type`: `auth_required` or `_OTHER` on failure; empty on success
* MCP governance labels: `virtual_key_id` / `virtual_key_name`, `team_id` / `team_name`, `customer_id` / `customer_name`, `business_unit_id` / `business_unit_name`
Only tool executions are recorded — lifecycle operations (`ping` / `list_tools`) and codemode tools are skipped. Unlike the LLM metrics, MCP metrics do **not** carry `provider` / `model` or a `network_transport` label.
***
## Monitoring Examples
### Success Rate Monitoring
Track the success rate of requests to different providers:
```promql theme={null}
# Success rate by provider
rate(bifrost_success_requests_total[5m]) /
rate(bifrost_upstream_requests_total[5m]) * 100
```
### Token Usage Analysis
Monitor token consumption across different models:
```promql theme={null}
# Input tokens per minute by model
increase(bifrost_input_tokens_total[1m])
# Output tokens per minute by model
increase(bifrost_output_tokens_total[1m])
# Token efficiency (output/input ratio)
rate(bifrost_output_tokens_total[5m]) /
rate(bifrost_input_tokens_total[5m])
```
### Cost Tracking
Monitor spending across providers and models:
```promql theme={null}
# Cost per second by provider
sum by (provider) (rate(bifrost_cost_total[1m]))
# Daily cost estimate
sum by (provider) (increase(bifrost_cost_total[1d]))
# Cost per request by provider and model
sum by (provider, model) (rate(bifrost_cost_total[5m])) /
sum by (provider, model) (rate(bifrost_upstream_requests_total[5m]))
```
### Cache Performance
Track cache effectiveness:
```promql theme={null}
# Cache hit rate by type
rate(bifrost_cache_hits_total[5m]) /
rate(bifrost_upstream_requests_total[5m]) * 100
# Direct vs semantic cache hits
sum by (cache_type) (rate(bifrost_cache_hits_total[5m]))
```
### Error Rate Analysis
Monitor error patterns:
```promql theme={null}
# Error rate by provider
rate(bifrost_error_requests_total[5m]) /
rate(bifrost_upstream_requests_total[5m]) * 100
# Errors by model
sum by (model) (rate(bifrost_error_requests_total[5m]))
```
***
## Configuration
Configure custom Prometheus labels to add dimensions for filtering and analysis:
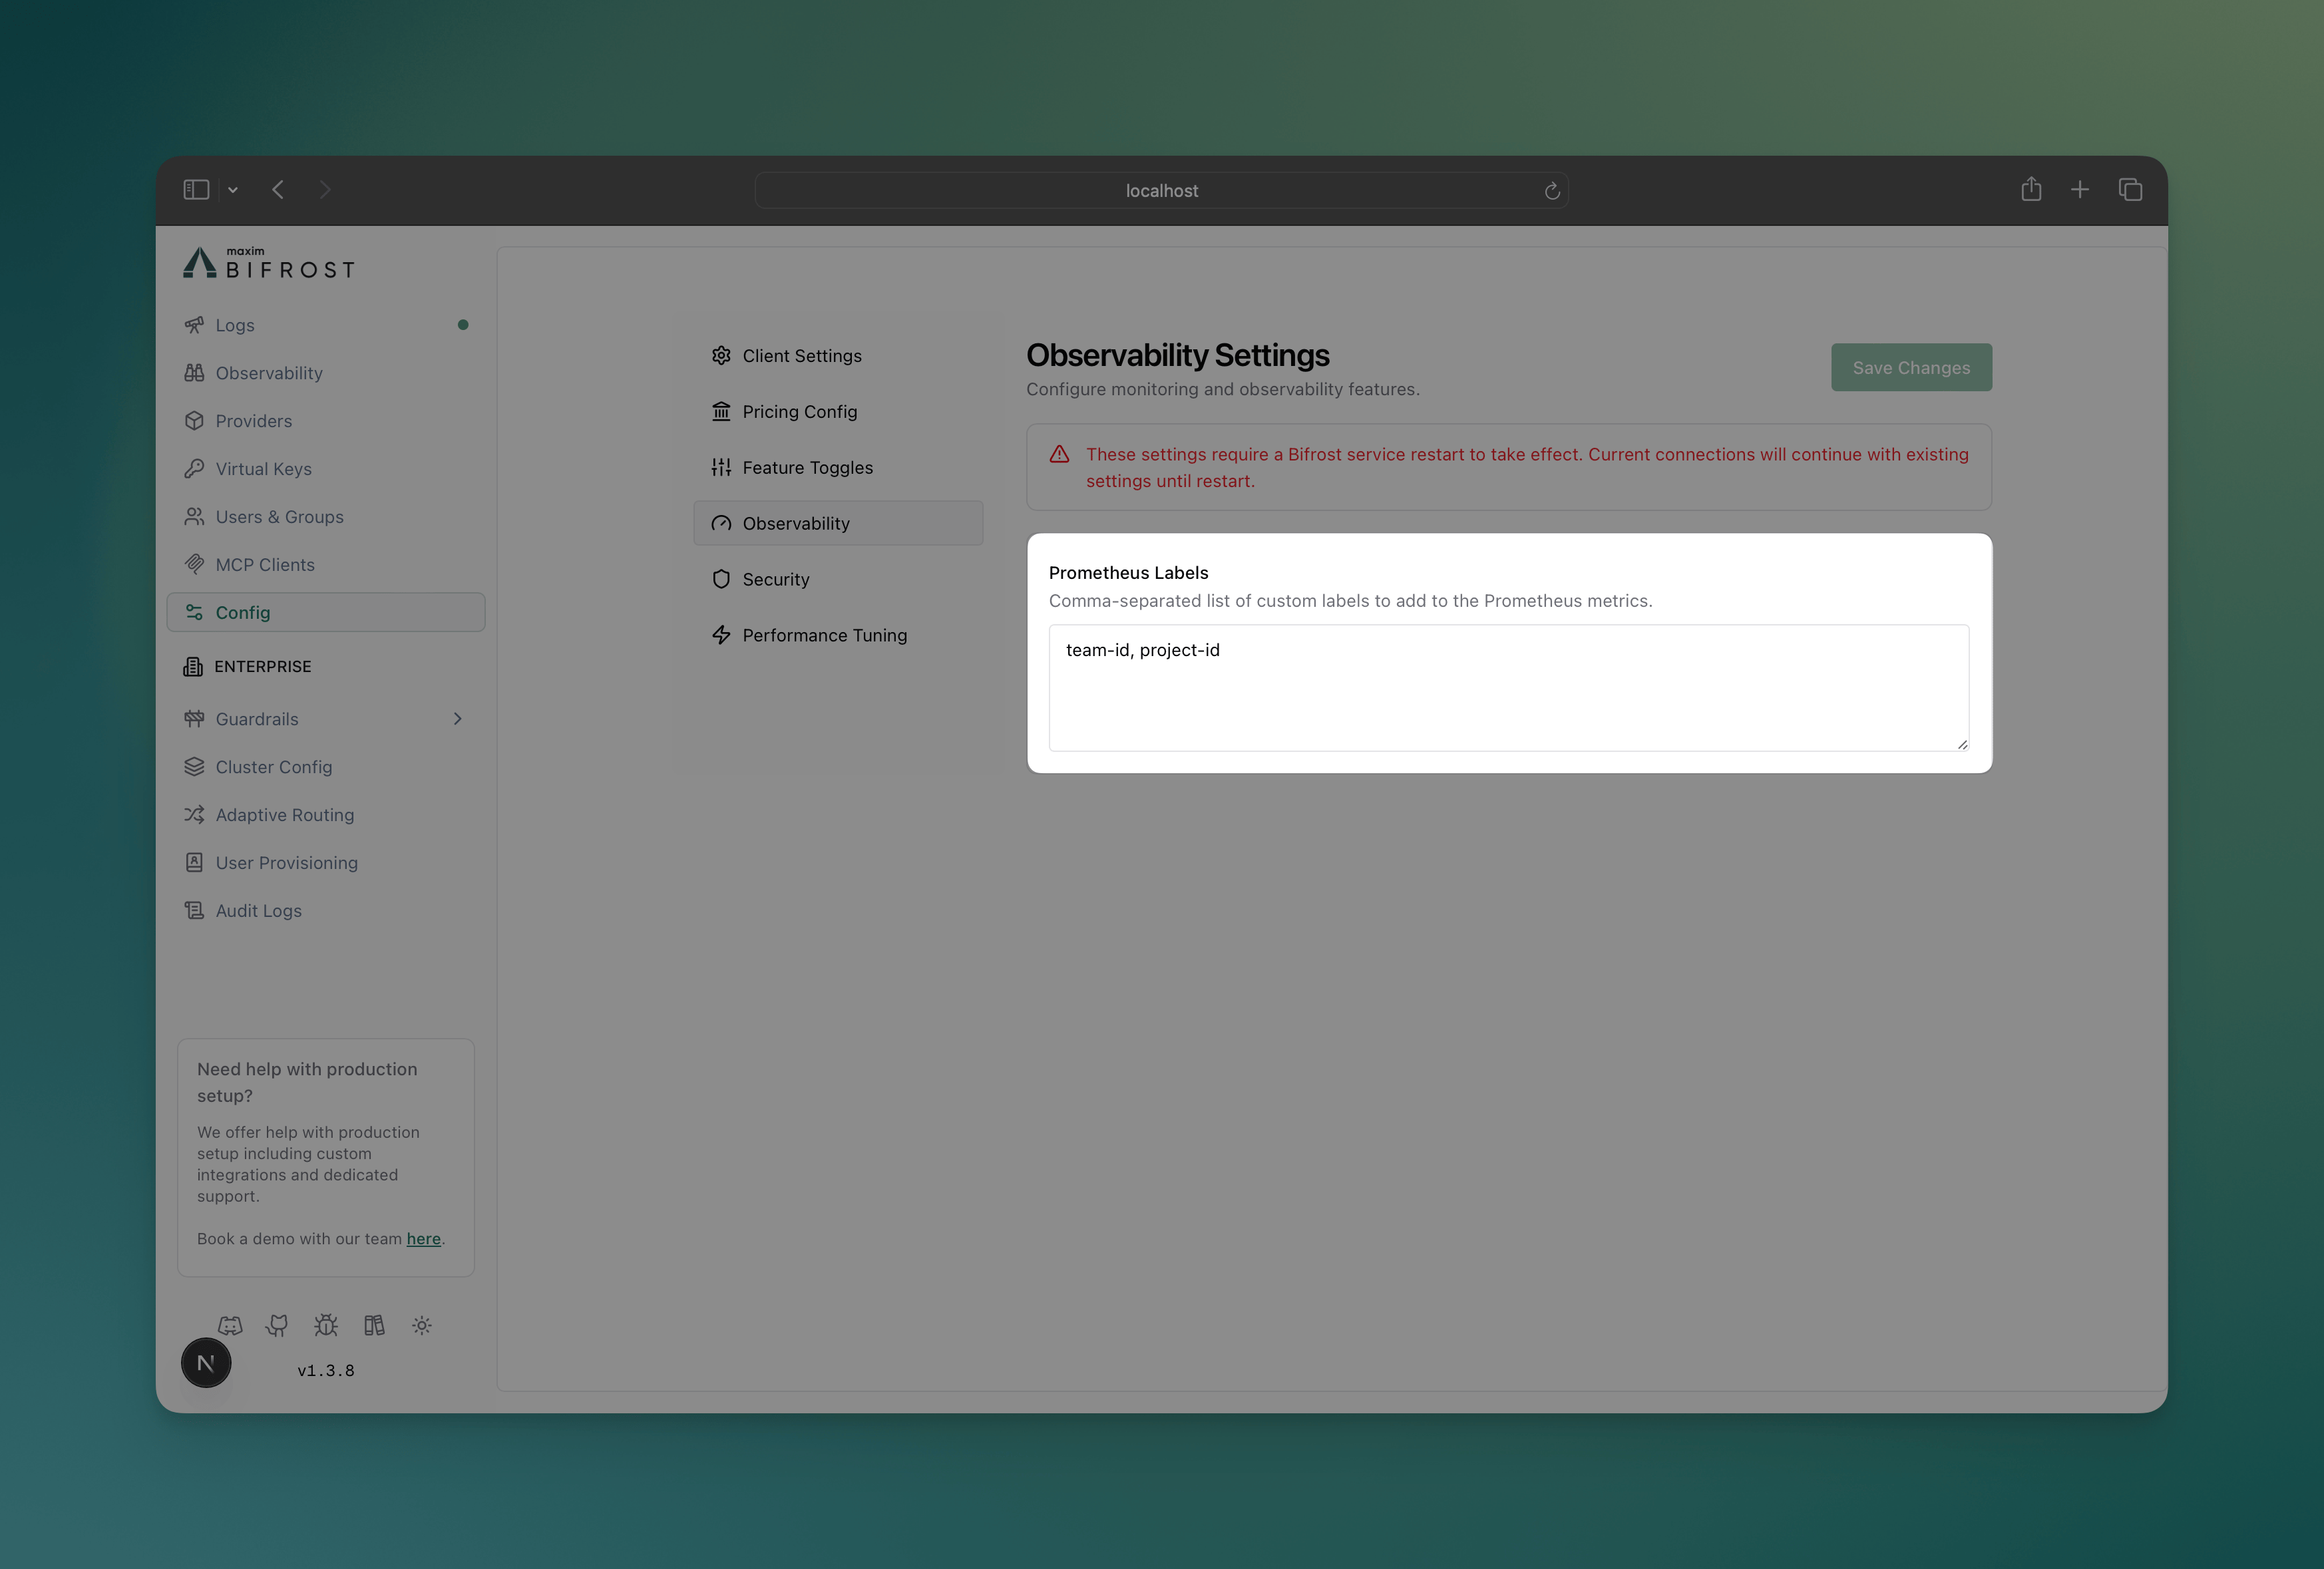 1. **Navigate to Configuration**
* Open Bifrost UI at `http://localhost:8080`
* Go to **Config** tab
2. **Prometheus Labels**
```
Custom Labels: team, environment, organization, project
```
```bash theme={null}
# Update prometheus labels via API
curl -X PATCH http://localhost:8080/config \
-H "Content-Type: application/json" \
-d '{
"client": {
"prometheus_labels": ["team", "environment", "organization", "project"]
}
}'
```
```json theme={null}
{
"client": {
"prometheus_labels": ["team", "environment", "organization", "project"],
"drop_excess_requests": false,
"initial_pool_size": 300
}
}
```
### Dynamic Label Injection
Add custom label values at runtime using `x-bf-dim-*` headers:
```bash theme={null}
# Add custom labels to specific requests
curl -X POST http://localhost:8080/v1/chat/completions \
-H "Content-Type: application/json" \
-H "x-bf-dim-team: engineering" \
-H "x-bf-dim-environment: production" \
-H "x-bf-dim-organization: my-org" \
-H "x-bf-dim-project: my-project" \
-d '{
"model": "gpt-4o-mini",
"messages": [{"role": "user", "content": "Hello!"}]
}'
```
**Header Format:**
* Prefix: `x-bf-dim-`
* Label name: Any string after the prefix, except reserved metric labels like `path` and `method`
* Value: String value for the label
These runtime dimensions are also forwarded to the other observability backends. The same `x-bf-dim-*` values appear in internal logs, OpenTelemetry span attributes, and Maxim tags.
Legacy `x-bf-prom-*` headers still work for Prometheus-only behavior, but they are deprecated. When both prefixes provide the same label, `x-bf-dim-*` wins.
***
## Infrastructure Setup
### Development & Testing
For local development and testing, use the provided Docker Compose setup:
```bash theme={null}
# Navigate to telemetry plugin directory
cd plugins/telemetry
# Start Prometheus and Grafana
docker-compose up -d
# Access endpoints
# Prometheus: http://localhost:9090
# Grafana: http://localhost:3000 (admin/admin)
# Bifrost metrics: http://localhost:8080/metrics
```
**Development Only**: The provided Docker Compose setup is for testing
purposes only. Do not use in production without proper security, scaling, and
persistence configuration.
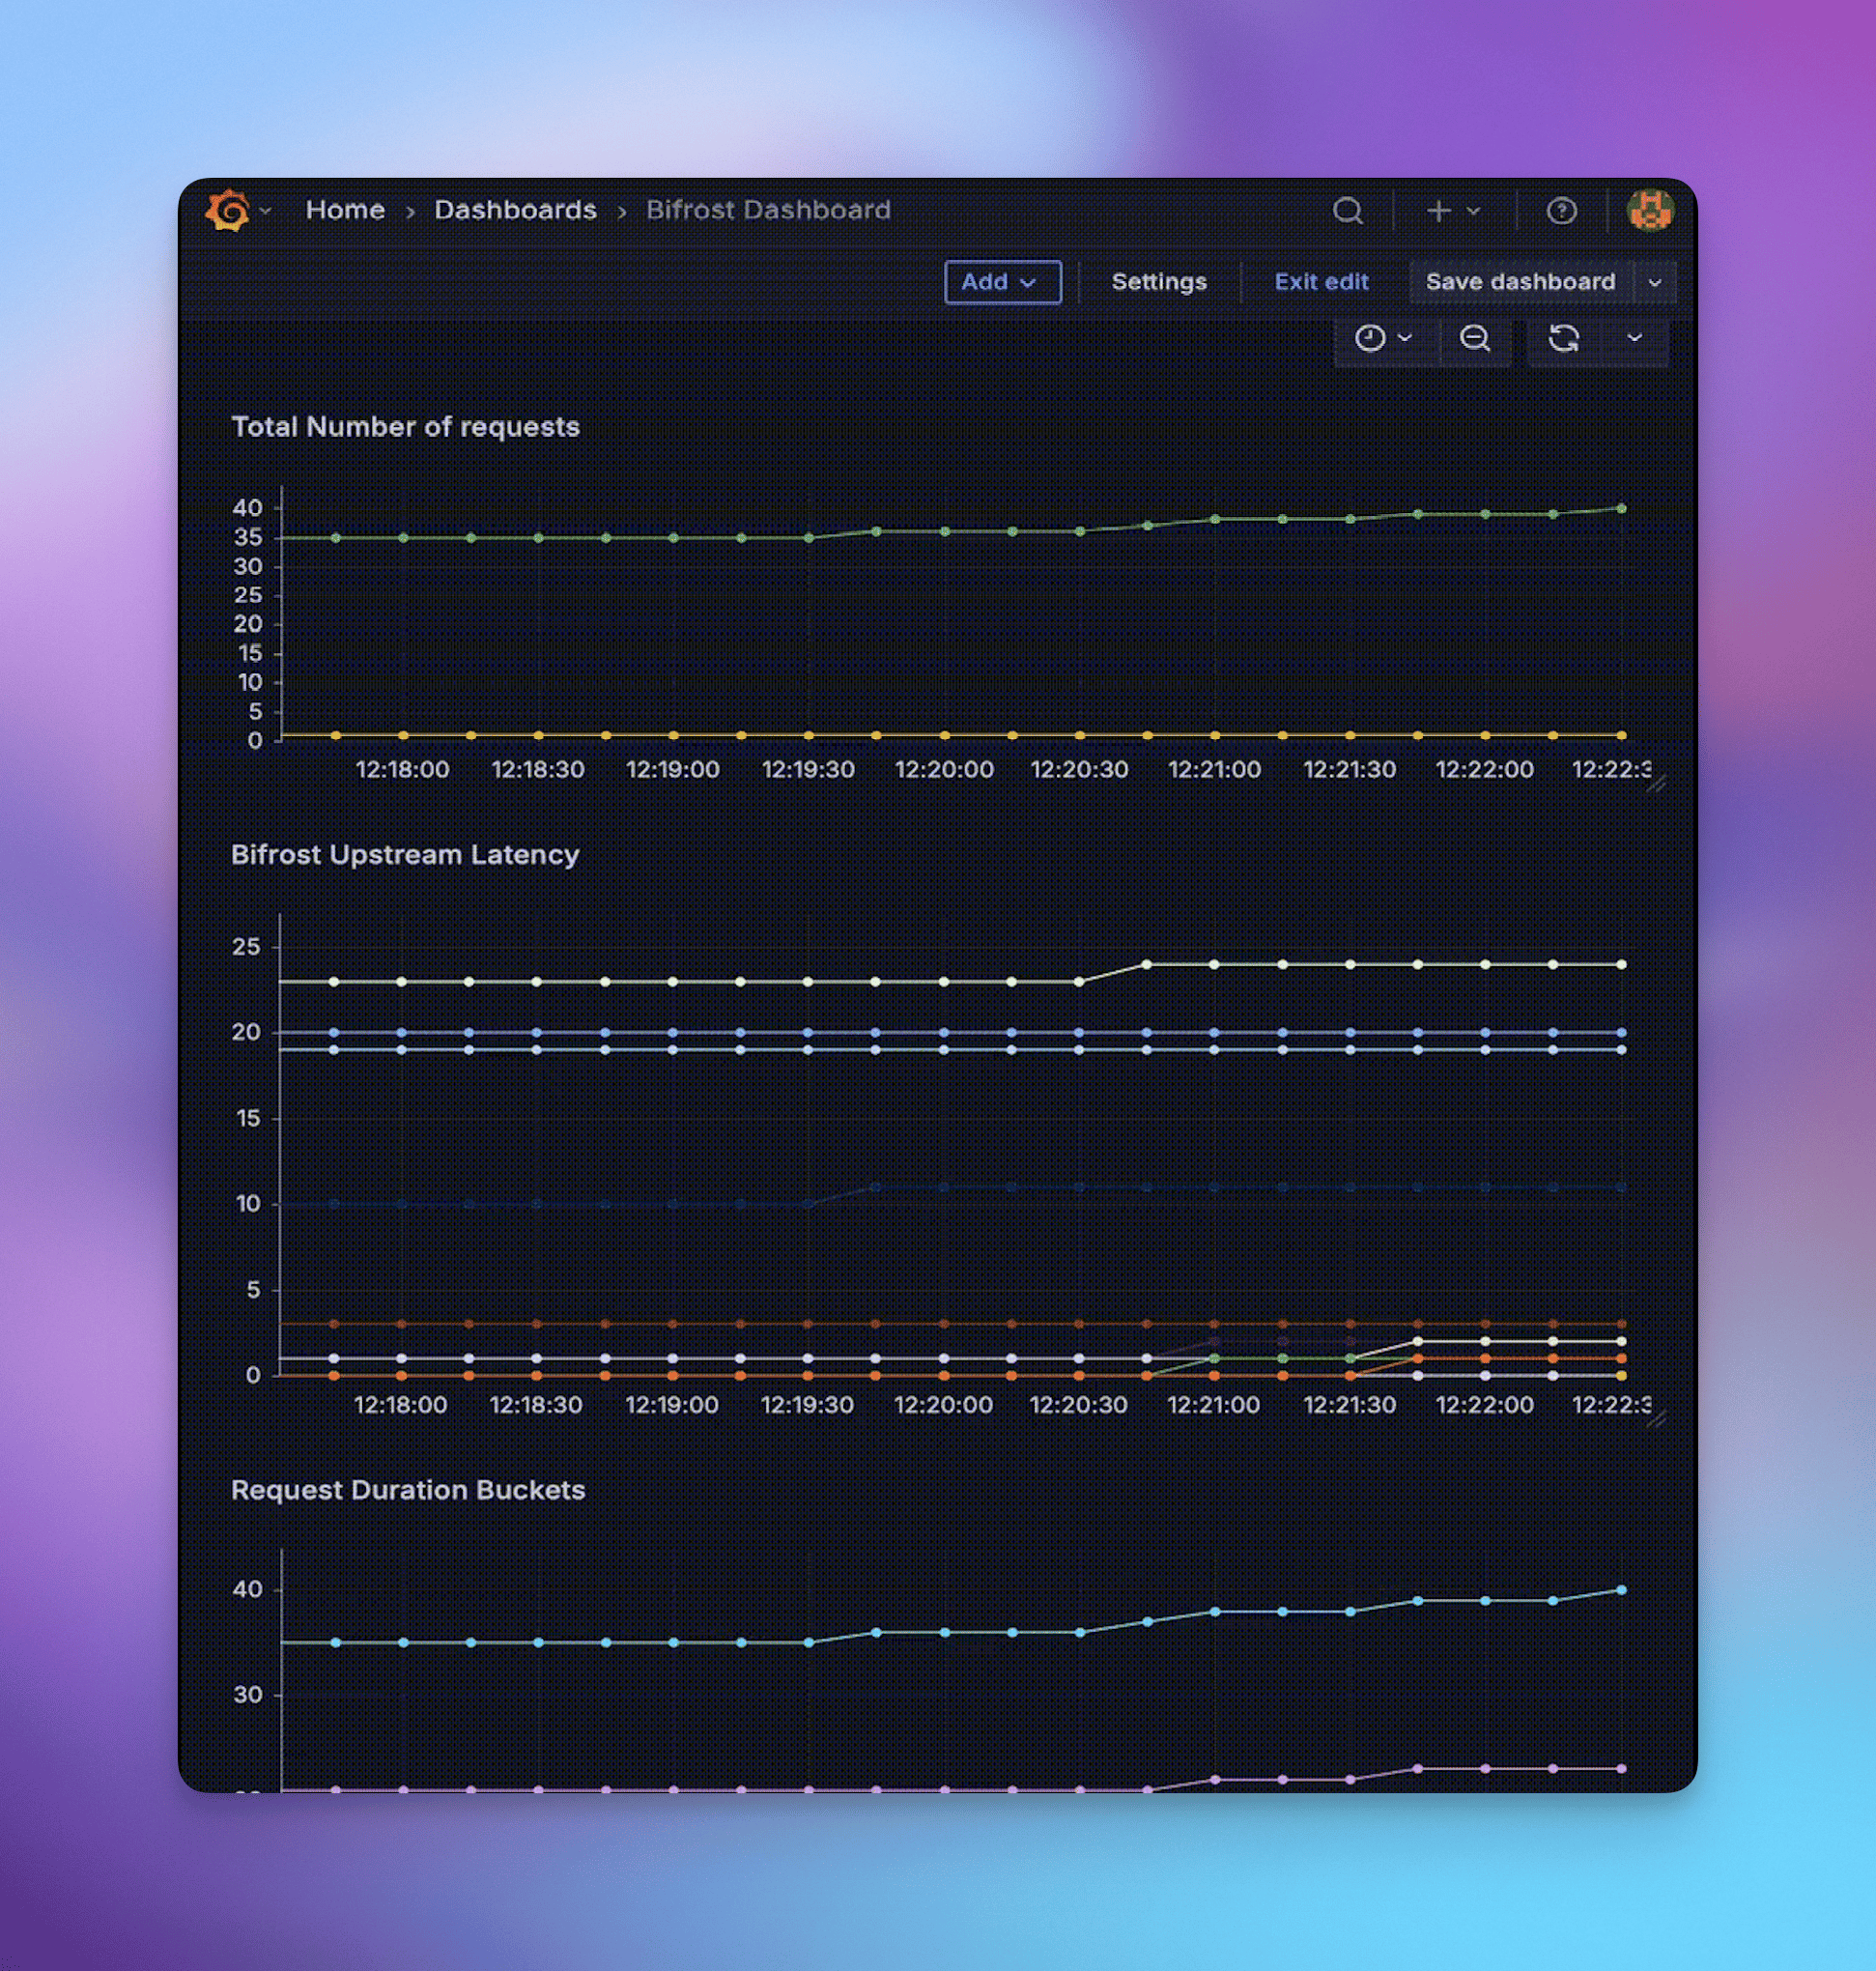
You can use the Prometheus scraping endpoint to create your own Grafana dashboards. Given below are few examples created using the Docker Compose setup.
1. **Navigate to Configuration**
* Open Bifrost UI at `http://localhost:8080`
* Go to **Config** tab
2. **Prometheus Labels**
```
Custom Labels: team, environment, organization, project
```
```bash theme={null}
# Update prometheus labels via API
curl -X PATCH http://localhost:8080/config \
-H "Content-Type: application/json" \
-d '{
"client": {
"prometheus_labels": ["team", "environment", "organization", "project"]
}
}'
```
```json theme={null}
{
"client": {
"prometheus_labels": ["team", "environment", "organization", "project"],
"drop_excess_requests": false,
"initial_pool_size": 300
}
}
```
### Dynamic Label Injection
Add custom label values at runtime using `x-bf-dim-*` headers:
```bash theme={null}
# Add custom labels to specific requests
curl -X POST http://localhost:8080/v1/chat/completions \
-H "Content-Type: application/json" \
-H "x-bf-dim-team: engineering" \
-H "x-bf-dim-environment: production" \
-H "x-bf-dim-organization: my-org" \
-H "x-bf-dim-project: my-project" \
-d '{
"model": "gpt-4o-mini",
"messages": [{"role": "user", "content": "Hello!"}]
}'
```
**Header Format:**
* Prefix: `x-bf-dim-`
* Label name: Any string after the prefix, except reserved metric labels like `path` and `method`
* Value: String value for the label
These runtime dimensions are also forwarded to the other observability backends. The same `x-bf-dim-*` values appear in internal logs, OpenTelemetry span attributes, and Maxim tags.
Legacy `x-bf-prom-*` headers still work for Prometheus-only behavior, but they are deprecated. When both prefixes provide the same label, `x-bf-dim-*` wins.
***
## Infrastructure Setup
### Development & Testing
For local development and testing, use the provided Docker Compose setup:
```bash theme={null}
# Navigate to telemetry plugin directory
cd plugins/telemetry
# Start Prometheus and Grafana
docker-compose up -d
# Access endpoints
# Prometheus: http://localhost:9090
# Grafana: http://localhost:3000 (admin/admin)
# Bifrost metrics: http://localhost:8080/metrics
```
**Development Only**: The provided Docker Compose setup is for testing
purposes only. Do not use in production without proper security, scaling, and
persistence configuration.
You can use the Prometheus scraping endpoint to create your own Grafana dashboards. Given below are few examples created using the Docker Compose setup.
 ### Production Deployment
For production environments:
1. **Deploy Prometheus** with proper persistence, retention, and security
2. **Configure scraping** to target your Bifrost instances at `/metrics`
3. **Set up Grafana** with authentication and dashboards
4. **Configure alerts** based on your SLA requirements
**Prometheus Scrape Configuration:**
```yaml theme={null}
scrape_configs:
- job_name: "bifrost-gateway"
static_configs:
- targets: ["bifrost-instance-1:8080", "bifrost-instance-2:8080"]
scrape_interval: 30s
metrics_path: /metrics
# If Bifrost auth is enabled, add:
# basic_auth:
# username: ''
# password: ''
```
If you have Bifrost authentication enabled (`auth_config`), you must include
`basic_auth` in the scrape config with your `admin_username` and
`admin_password`. See the [Prometheus
docs](/features/observability/prometheus#pull-based-scraping) for details.
### Production Alerting Examples
Configure alerts for critical scenarios using the new metrics:
**High Error Rate Alert:**
```yaml theme={null}
- alert: BifrostHighErrorRate
# Excludes caller_* (bad model names, malformed requests) and policy_* (governance
# refusals: budgets, rate limits, blocked models). Neither is a provider or gateway
# failure, and policy refusals short-circuit before any provider call while still
# counting in bifrost_upstream_requests_total — so without this they inflate both
# sides of the ratio. provider_* and bifrost_* are what this alert is for. See the
# error_type reference: /features/observability/prometheus#error-types
expr: sum by (provider) (rate(bifrost_error_requests_total{error_type!~"(caller|policy)_.*"}[5m])) / sum by (provider) (rate(bifrost_upstream_requests_total[5m])) > 0.05
for: 2m
labels:
severity: warning
annotations:
summary: "High error rate detected for provider {{ $labels.provider }} ({{ $value | humanizePercentage }})"
```
**High Cost Alert:**
```yaml theme={null}
- alert: BifrostHighCosts
expr: sum by (provider) (increase(bifrost_cost_total[1d])) > 100 # $100/day threshold
for: 10m
labels:
severity: warning
annotations:
summary: 'Daily cost for provider {{ $labels.provider }} exceeds $100 ({{ $value | printf "%.2f" }})'
```
**Cache Performance Alert:**
```yaml theme={null}
- alert: BifrostLowCacheHitRate
expr: sum by (provider) (rate(bifrost_cache_hits_total[15m])) / sum by (provider) (rate(bifrost_upstream_requests_total[15m])) < 0.1
for: 5m
labels:
severity: info
annotations:
summary: "Cache hit rate for provider {{ $labels.provider }} below 10% ({{ $value | humanizePercentage }})"
```
***
## Next Steps
* **[Prometheus Documentation](https://prometheus.io/docs/)** - Official Prometheus guides
* **[Grafana Setup](https://grafana.com/docs/)** - Dashboard creation and management
* **[Tracing](./observability/default)** - Request/response logging for detailed analysis
This documentation is built and hosted on [Mintlify](https://mintlify.com), a developer documentation platform.
### Production Deployment
For production environments:
1. **Deploy Prometheus** with proper persistence, retention, and security
2. **Configure scraping** to target your Bifrost instances at `/metrics`
3. **Set up Grafana** with authentication and dashboards
4. **Configure alerts** based on your SLA requirements
**Prometheus Scrape Configuration:**
```yaml theme={null}
scrape_configs:
- job_name: "bifrost-gateway"
static_configs:
- targets: ["bifrost-instance-1:8080", "bifrost-instance-2:8080"]
scrape_interval: 30s
metrics_path: /metrics
# If Bifrost auth is enabled, add:
# basic_auth:
# username: ''
# password: ''
```
If you have Bifrost authentication enabled (`auth_config`), you must include
`basic_auth` in the scrape config with your `admin_username` and
`admin_password`. See the [Prometheus
docs](/features/observability/prometheus#pull-based-scraping) for details.
### Production Alerting Examples
Configure alerts for critical scenarios using the new metrics:
**High Error Rate Alert:**
```yaml theme={null}
- alert: BifrostHighErrorRate
# Excludes caller_* (bad model names, malformed requests) and policy_* (governance
# refusals: budgets, rate limits, blocked models). Neither is a provider or gateway
# failure, and policy refusals short-circuit before any provider call while still
# counting in bifrost_upstream_requests_total — so without this they inflate both
# sides of the ratio. provider_* and bifrost_* are what this alert is for. See the
# error_type reference: /features/observability/prometheus#error-types
expr: sum by (provider) (rate(bifrost_error_requests_total{error_type!~"(caller|policy)_.*"}[5m])) / sum by (provider) (rate(bifrost_upstream_requests_total[5m])) > 0.05
for: 2m
labels:
severity: warning
annotations:
summary: "High error rate detected for provider {{ $labels.provider }} ({{ $value | humanizePercentage }})"
```
**High Cost Alert:**
```yaml theme={null}
- alert: BifrostHighCosts
expr: sum by (provider) (increase(bifrost_cost_total[1d])) > 100 # $100/day threshold
for: 10m
labels:
severity: warning
annotations:
summary: 'Daily cost for provider {{ $labels.provider }} exceeds $100 ({{ $value | printf "%.2f" }})'
```
**Cache Performance Alert:**
```yaml theme={null}
- alert: BifrostLowCacheHitRate
expr: sum by (provider) (rate(bifrost_cache_hits_total[15m])) / sum by (provider) (rate(bifrost_upstream_requests_total[15m])) < 0.1
for: 5m
labels:
severity: info
annotations:
summary: "Cache hit rate for provider {{ $labels.provider }} below 10% ({{ $value | humanizePercentage }})"
```
***
## Next Steps
* **[Prometheus Documentation](https://prometheus.io/docs/)** - Official Prometheus guides
* **[Grafana Setup](https://grafana.com/docs/)** - Dashboard creation and management
* **[Tracing](./observability/default)** - Request/response logging for detailed analysis
This documentation is built and hosted on [Mintlify](https://mintlify.com), a developer documentation platform.